I am going to create a “Graph View” of Wikipedia as a POC project to test Windsurf capabilities.
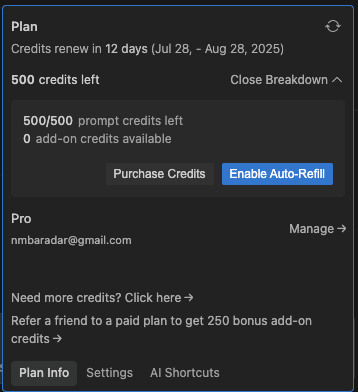
The Pro plan costs $15/month and includes:
- 500 prompt credits/month
- All premium models
- Previews
- App Deploys
I used this as my first query:
I want to create a visual representation of the wikipedia ontology in the form of a graph view, akin to the graph view in Obsidian that connects nodes together. I want this graph view to look very modern and be very responsive. I want the user to be greeted with a screen that has a search bar in the center, and the user can type in any word (which will then suggest/autocomplete existing wikipedia articles) and once the user finishes and submits I want the search bar to move to the top and I want a graph to generate with the central node being the users query and only going out 1 layer from the central node. The connecting nodes will be any MAIN ARTICLES that were linked inside the central node article. The user should be able to click any node to go to that corresponding wikipedia article.
Holy shit I created a functional website in a little over half an hour… I barely did anything.
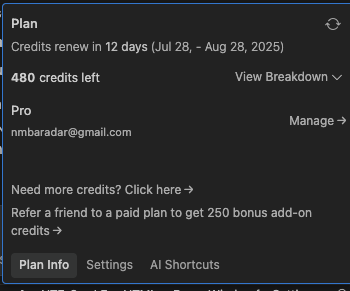
It took 20 credits
You can find the live site here: https://nbaradar.github.io/wikipedia-graph/
Aug 17 Updates
At the time of writing, it’s basically choosing random articles as related nodes. I have plenty of credits left. I am going to implement page ranking and display nodes based on how many connecting nodes they have.
Okay first of all, let’s create a list of additional features we will implement:
- Node Filtering
- Currently we are adding nodes alphabetically. This isn’t useful. What other systems of filtering can we use?
- Page ranking = Sort associated pages based on view count/popularity, then list the top most popular articles as connected nodes
- Currently we are adding nodes alphabetically. This isn’t useful. What other systems of filtering can we use?
- Increase/Decrease Nodes - Done
- Increase/Decrease Layers
- Resize/Pane slider to adjust each pane. (Left to right, so I can increase the wiki article size, OR increase the graph)
- Rabbit-hunting mode VS Standard
- Rabbit hunting = every time you click a new node, it becomes the central node
- Standard = Central node stays static regardless of selected connecting nodes
Could add a lot more, like visual customizations and ability to increase/decrease layers and nodes.
I looked into the code structure and refactored everything to match
Continued Development can be found here: