The cost function tells us how well the model is doing so we can try to improve it.
Model:
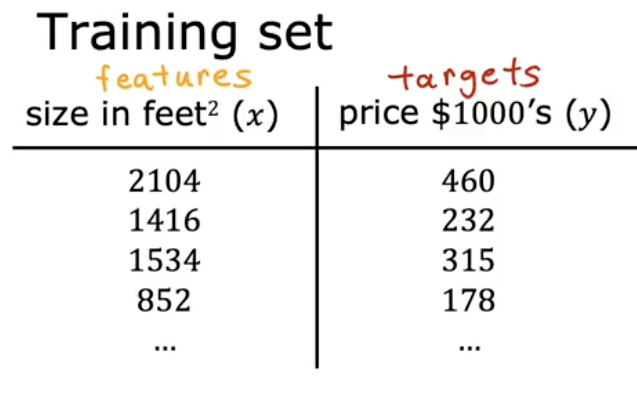
This is our training set for the model () :
: parameters (also referred to as coefficients / weights)
Parameters are the variables you can adjust during training to improve the model. Depending on the values you chose for , you’ll get a different function
Let’s graph different values for based on
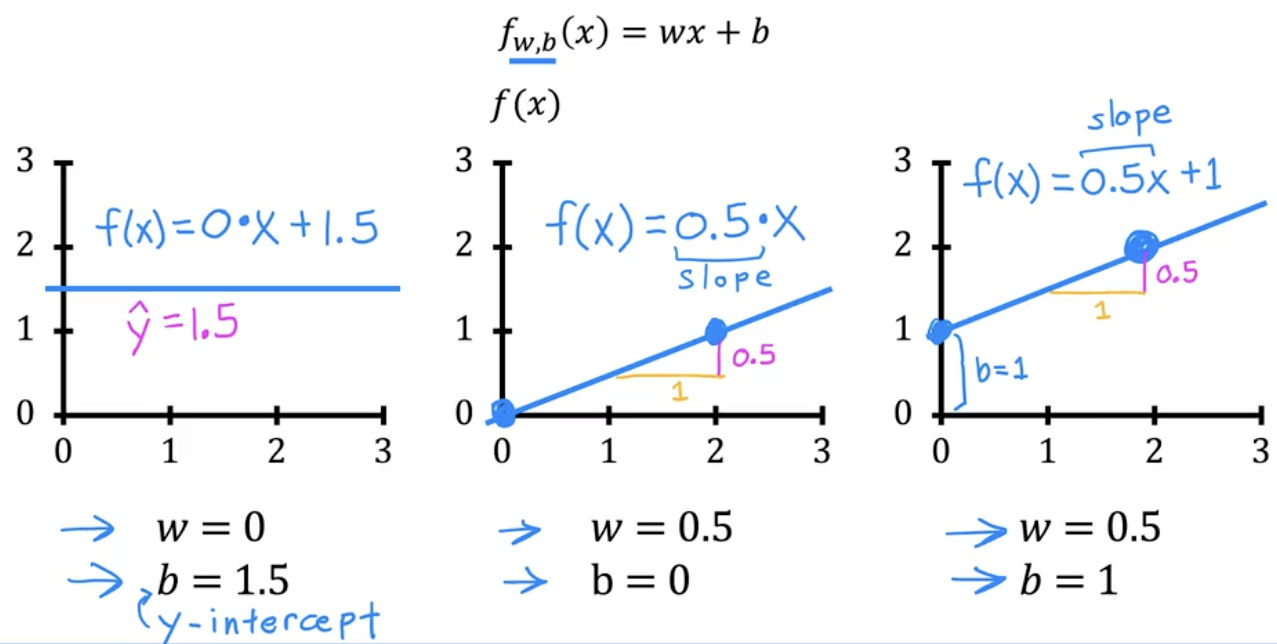
You can intuit that w dictates the slope of f(x)
You want to find correct values for so that matches your training set.
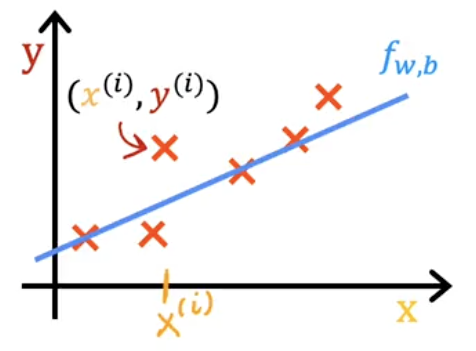
is a training example. y is the target
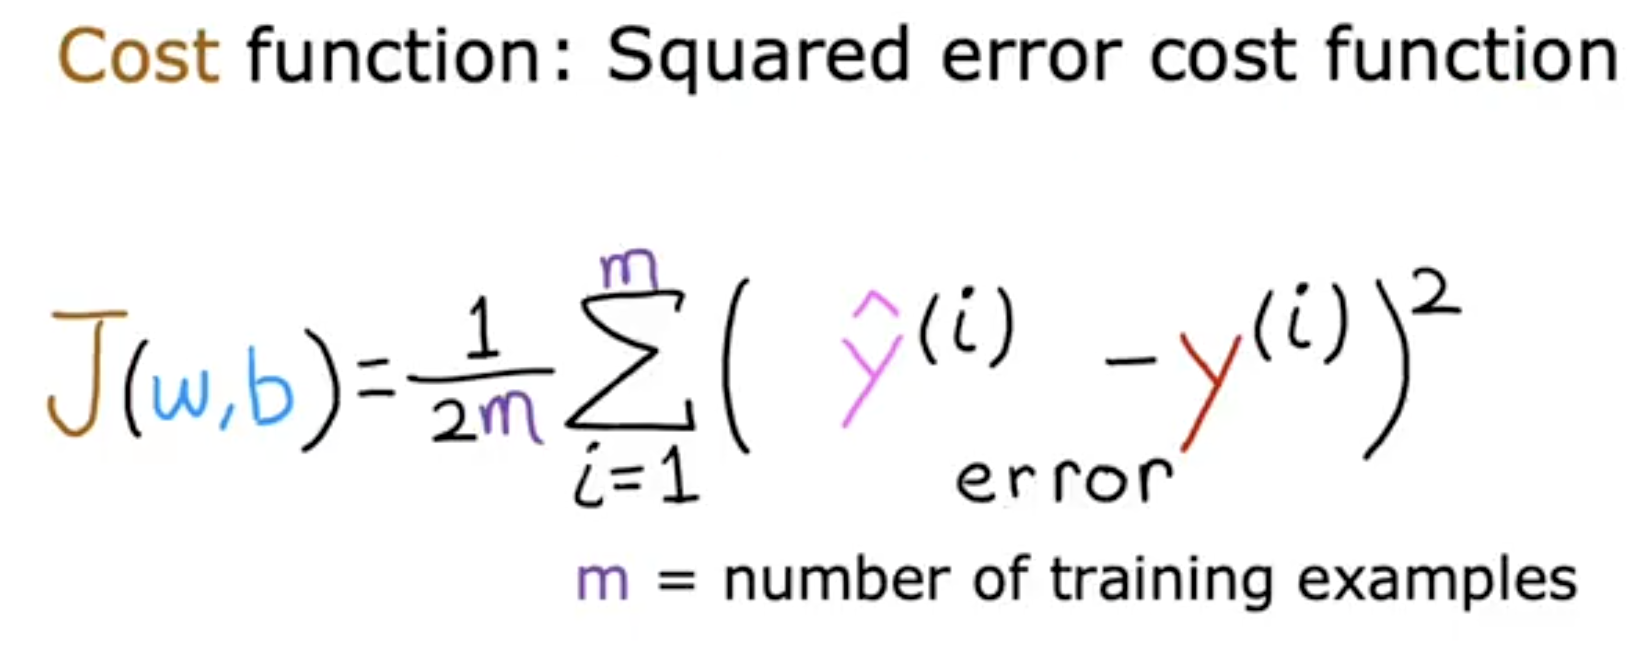
The Squared Error Cost Function is one type of many cost functions that machine learning engineers could use depending on the model they are building. It is also the most commonly used Cost Function, especially for Linear Regression Models.
To build a cost function that doesn’t get too large based on the number of training examples we compute the average squared error instead of total squared error by dividing by
You can also write the cost function like this:
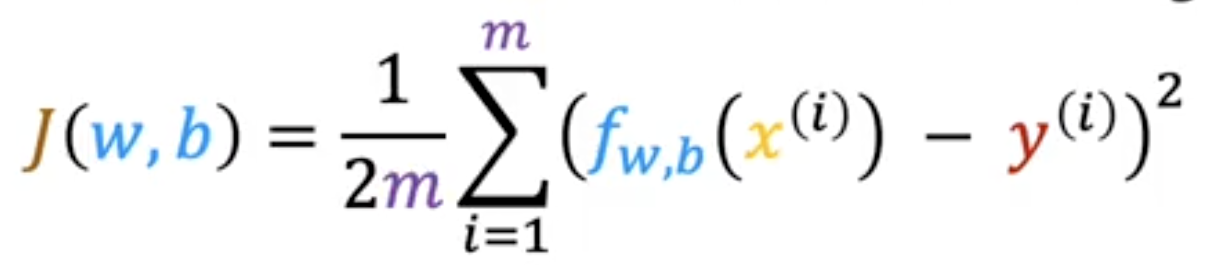
We can replace the prediction with
This is the cost function: . Which of these are the parameters of the model that can be adjusted?
Answer: and are parameters of the model, adjusted as the model learns from the data. They’re also referred to as “coefficients” or “weights”
When using the model we want to find the parameters that best fit our training set.
We use the cost function for this.
The goal is to minimize which will give us our desired params
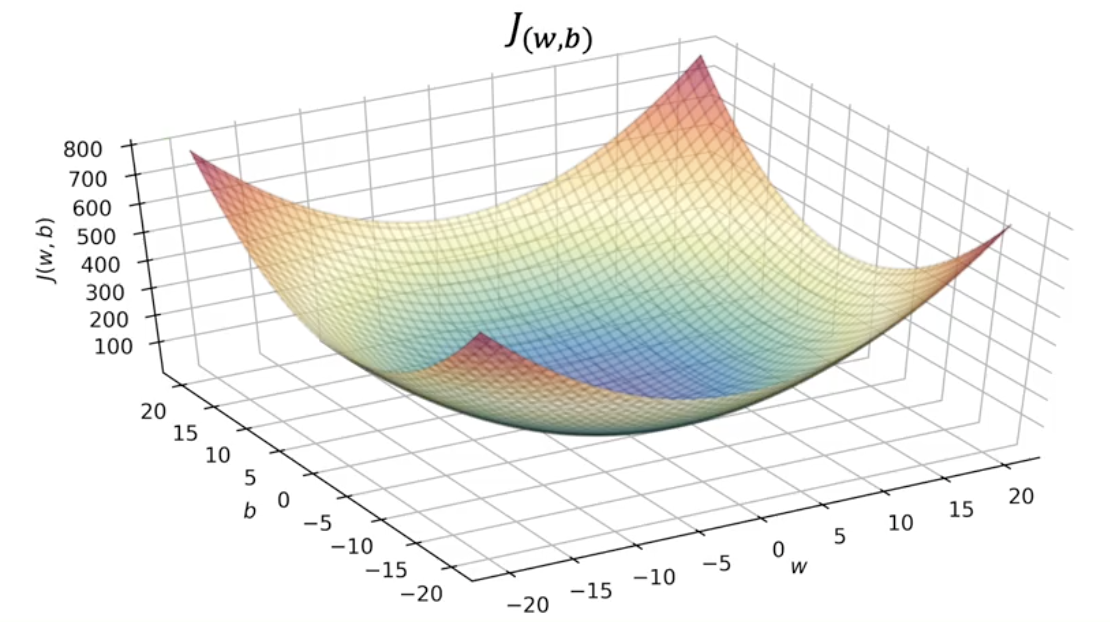
If we were to graph the squared cost function for a linear regression model with params it would look something like this, but slightly different based on training set. Both w and b are on the x axis below.
This is known as a contour plot, which is similar to topographical maps

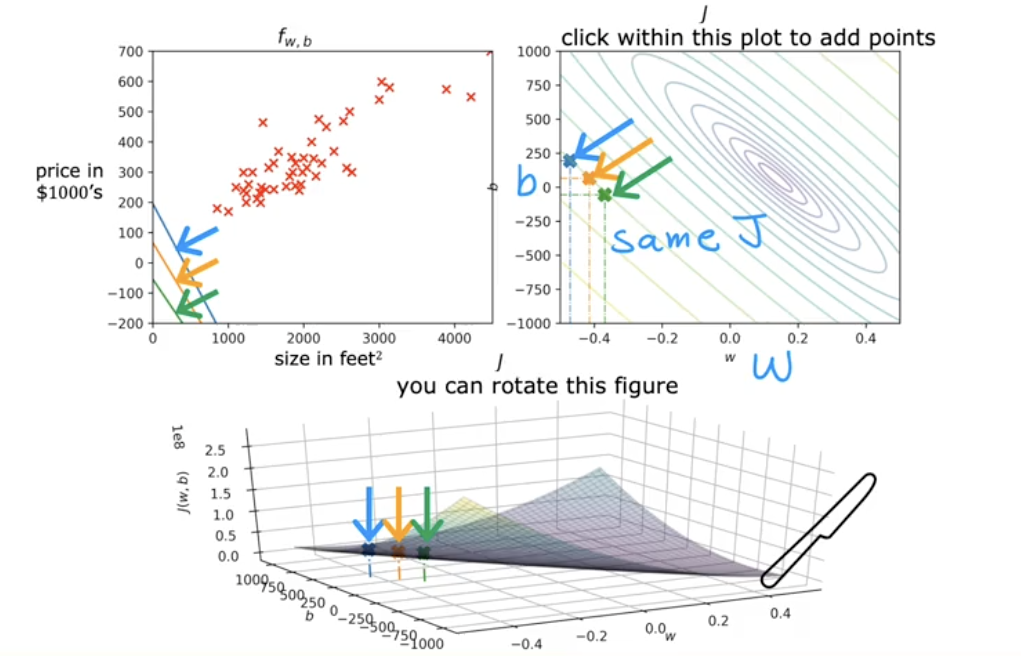
The plot on the top right is the horizontal slices of the contour plot below. This is why the same J error rate is on the same colored slice.
For , which of the following are the inputs that are fed to the model? A: | B: | C: and | D:
Answer: D:
For linear regression, if you find parameters and so that is very close to zero, what can you conclude?
Answer: The selected values of the parameters and cause the algorithm to fit the training set well